Welcome to the WDNR "WaterExplorer" Application (WEx)
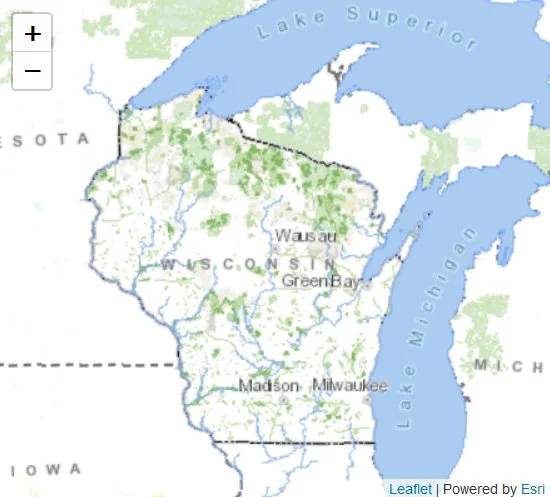
The WEx tool was designed as a companion tool to the Wisconsin Surface Water Data Viewer (SWDV). The SWDV is a tool that shows maps related to Wisconsin’s water resources, and WEx is a tool that allows users to explore characteristics of Wisconsin’s water resources. For detailed information about using the WDNR WaterExplorer application, click here.
When clicking on the links above, be patient and watch for a pop-up window labeled “Gathering reach data” in the lower right corner of your screen. After that pop-up window disappears, the water statistics will load as expected.
More information about using the WEx application
The Meaning of “Trophic State”
Secchi depth, total phosphorus (TP) and chlorophyll-α (chl-a) are all measures of a lake's trophic state, or the amount of nutrients available. We can convert results from each of these parameters into a trophic state index value, similar to how we might convert measures of temperature to Celsius or Fahrenheit so that we can compare them. We don't expect TSI values from Secchi depth, TP and chl-a to be exactly the same, and sometimes the differences can give us hints about what is going on in the lake.
Comparing Recent Trophic Averages to Lakes in the Same Natural Community
Points plotted in red on the WEx map are this lake's recent late summer average for the specified parameter. Late summer results from at least three of the last ten years must be found in order for the average to be calculated.
Box-and-whisker plots show the distribution of the equivalent averages from other Wisconsin lakes in the same natural community. The midline of the box is the median value, the top and bottom of the box are the 25th and 75th percentiles, and the whiskers extend to the 10th and 90th percentiles.
Lake Profile Data
This plot in the WEx application displays temperature and dissolved oxygen (DO) on the x-axis and depth on the y-axis. It is often important to see how temperature and DO change from the surface of the lake to the bottom. If temperature is constant, the lake is mixed, whereas if there is a large difference in temperature the lake is stratified, and conditions at the surface may be very different than conditions at the bottom.
Click the "Play" button to start an animation of all the lake profiles collected at this station. Use the slider just to the right of the "Play" button to pause or manually flip through profiles.
Temperature and dissolved oxygen readings are only displayed if two or more readings (with depths) were recorded on the same day.
Notes on Surface Water Quality Data
Secchi Depth: For observations where 'Secchi hit bottom' is TRUE, keep in mind the actual clarity of the lake is greater than what was measured.
Water Color: If the water color is BROWN and murky, this suggests that the secchi depth may have been mostly impacted by suspended sediments (tiny particles of soil or organic matter that are suspended in the water). Shallow lakes are often turbid because wind stirs up sediment from the bottom. High suspended sediments are often found in flowages and impoundments where precipitation runoff from the watershed transports solids via an incoming stream.
If the water color is BROWN but relatively clear, this suggests that the Secchi depth may have been mostly impacted by tannins (natural chemical compounds from decaying matter). Tannins are natural and not a result of pollution. Tannins can be distinguished from suspended sediment because the water (even though it's brown) looks clear like tea. Though tannins are not harmful per se, they are often not perceived as aesthetically pleasing as clear water. Tannins can also be important for decreasing light penetration into the water and decreasing algal growth.
If the water color is GREEN, this suggests that the secchi depth may be mostly impacted by algae. Algal blooms are generally considered to decrease the aesthetic appeal of a lake because people prefer clearer water to swim in and look at. Algae are always present in a balanced lake ecosystem. They are the photosynthetic basis of the food web. Algae are eaten by zooplankton, which are in turn eaten by fish. You will know algae are causing reduced Secchi depth if the water generally appears green when you assess the color against the white background of the secchi disc. On some lakes, water color may be GREEN while chlorophyll-α is low (< 7 μg/L). In these cases, the green color may be caused something besides algae, such as suspended marl.
The WEx tool queries data from the EPA Water Quality Portal. It may take a week or two for data entered into SWIMS to be passed to EPA and appear in this table. In addition, observations taken on the same day are averaged, so this table may not correspond exactly to data submitted to SWIMS.
Need to get in touch?
We’re here to answer your questions about lake management, local projects, or community involvement. Reach out for support, share your thoughts, or learn more about the North and South Twin Lakes District.


